Device diversity gives all web designers and developers a headache. It’s OK being a geek and testing our work on our own devices and pre-release browsers, but we can’t ignore the need for tools that help us tackle issues on hardware the manufacturer abandoned at birth, they can become ever-so-important when it belongs to your wage payer.
Fortunately front-ender tools continue to beat challenges and provide the means to quickly tool-up and get results without owning a personal device lab or managing a stack of virtual machines and SDKs. The list for cross-device, cross-browser testing tools is huge so this is a short comparison of a few of the most popular tools at the moment.
Synchronised browsing
Visually previewing a site across multiple browsers and devices can now be automated very simply, freeing your fingers from typing URLs on tiny phone keyboards. We no longer need to rely on static screenshots, we can do better!
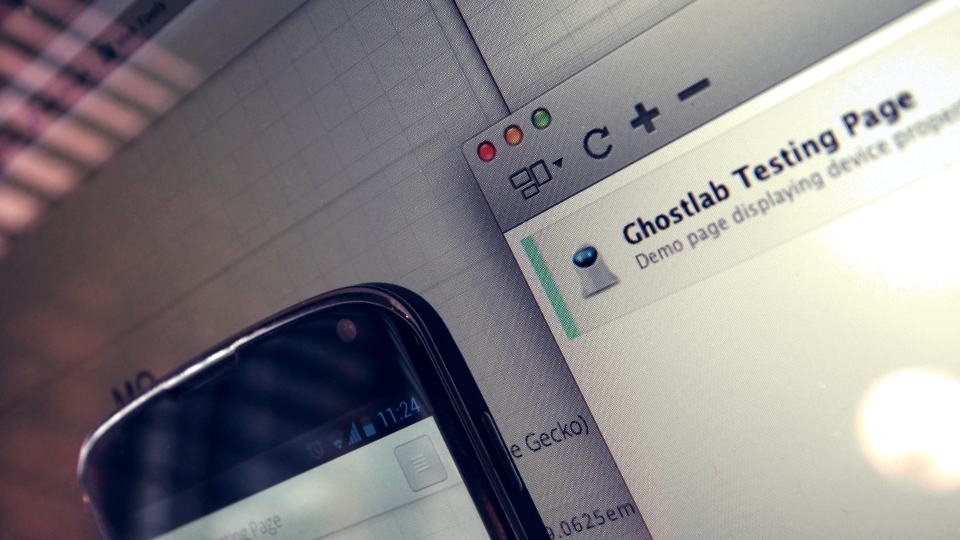
Ghostlab
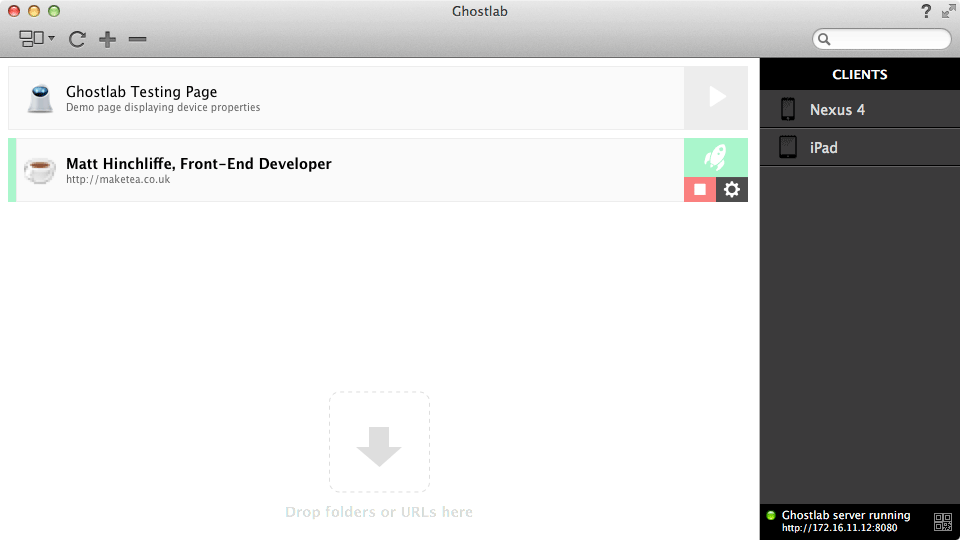
Ghostlab (OSX, $49USD) utilises the power of WebSockets (where available) to provide a persistent connection between remote clients and will synchronise scrolls, clicks and form posts so that site functionality as well as appearances can be tested. It works by setting up a local proxy server which automatically appends it’s clever JavaScript to each request. The URL for the server will need to be typed on each device but it can be bookmarked for quick access. It’s a well-made piece of software and it usually “just works”. Client debugging is provided by weinre (more later).
Adobe Edge Inspect
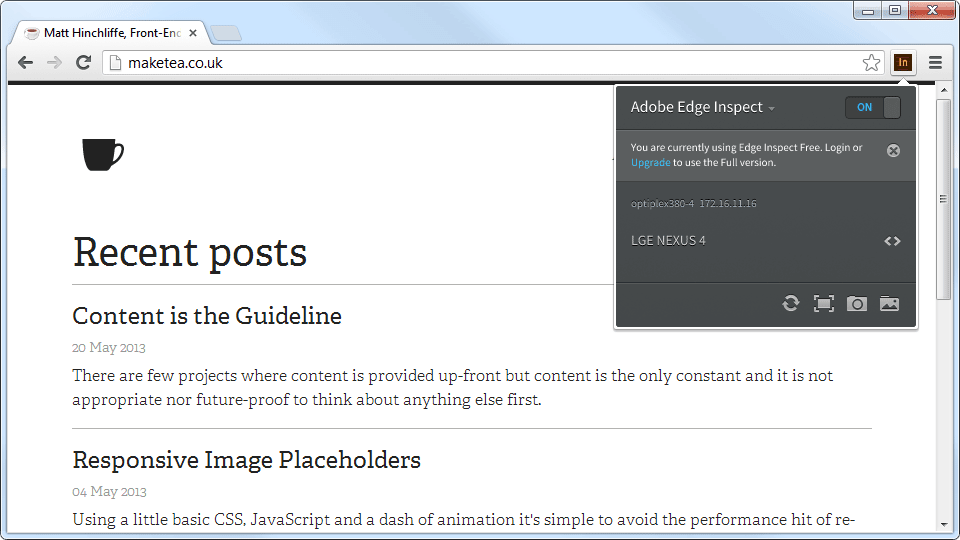
Adobe Edge Inspect (OSX/Windows, part of a Creative Cloud subscription) piggybacks on Apple’s Bonjour networking tool and provides basic synchronisation via a set of a extension and mobile apps. It’s a little tricky to setup devices and the host control extension is currently only available for Chrome, but on the plus side it has the added security of requiring each connected client to be paired with a key. Sites are browsed within the Edge Inspect application itself so the rendering capabilities and behaviour of different browsers can’t be tested. It lacks the synchronised browsing capabilities of Ghostlab but it does possess a party trick; a remote screenshot functionality (which also come with meta data about the device). Edge Inspect provides debugging via weinre.
Remote Preview
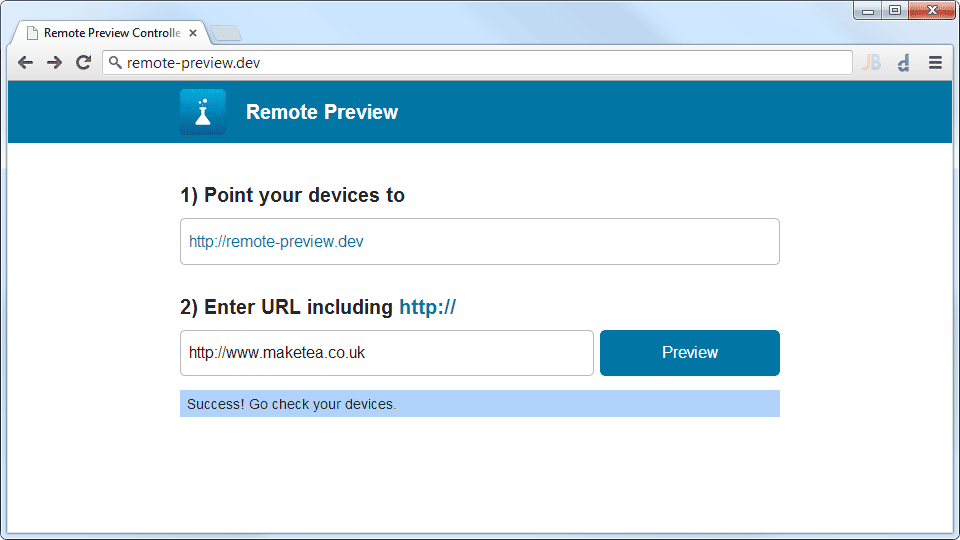
Remote Preview (In browser, free and Open Source) is a relatively simple, self-hosted script to quickly test sites on multiple devices without the need for typing the address each time into every device and browser. It works by putting the Remote Preview files into a publicly accessible location and pointing (and bookmarking!) the target browsers to it. The script uses an AJAX poll to test if a URL defined by the host has changed and displays it within an iframe, it’s basic but it’s fast, works almost everywhere and can be combined with weinre to provide a free toolkit.
Remote debugging
The ability to make modifications in real-time changed the way we build sites in the desktop browser. Apple and Android handheld devices are finally catching up!
iOS Devices on OSX
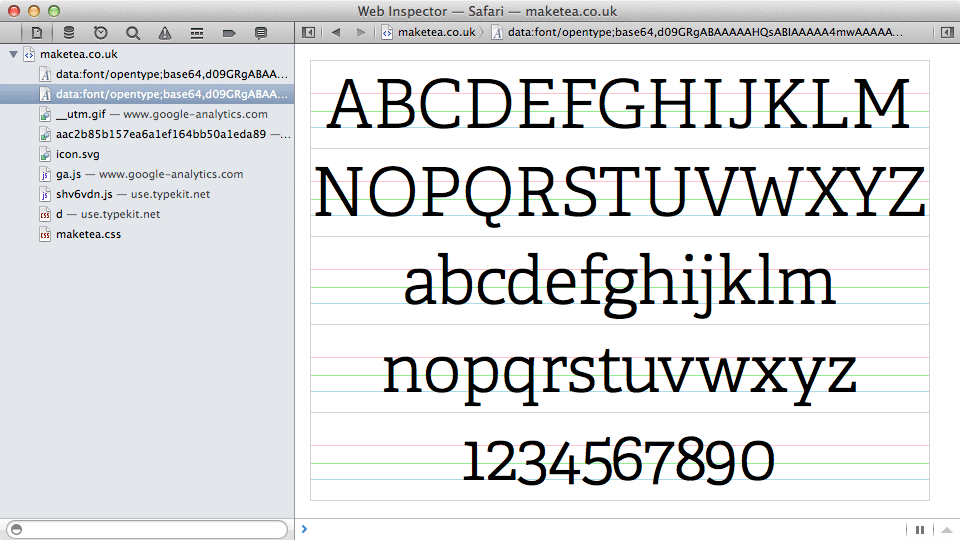
Debugging iOS web content on OSX (OSX 10.8, iOS 6) is by far the easiest remote debugging tool to setup. After enabling developer tools within Safari on the device and host computer the full Safari Web Inspector can be accessed from the developer menu. Though the interface can now be a little obtuse it provides enough features to solve the majority of problems, including the robust network tools and strong CSS editing we’re used to. Safari lacks some of the useful performance features now available in Chrome and Firefox but it works very well and is impressively ‘plug-and-play’.
Chrome for Android
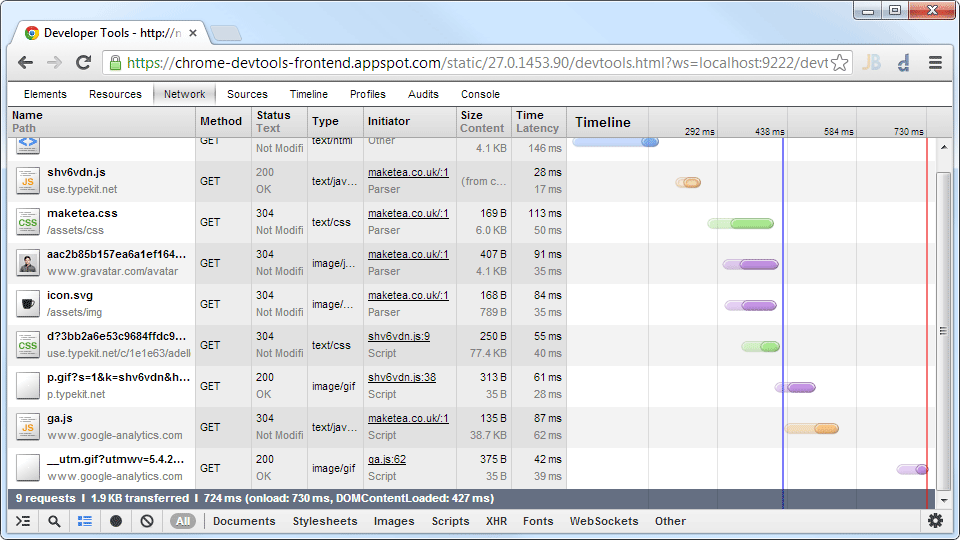
Remote debugging Chrome on Android (Android 4+) isn’t quite as slick to setup as the Safari equivalent but the full power of the continually evolving Chrome Developer Tools can be utilised after a few minutes preparation. It first requires downloading the Android SDK (OK, maybe not a few minutes) but actually only requires the Android debug bridge which can be extracted and the rest deleted. If you’re a Windows user you will need to install the USB drivers first via the SDK manager and possibly go through the process of un-installing and replacing any current drivers for the connected device. After enabling Android’s developer options connect the device, open the Chrome app and start the debug server.
Since Chrome 32 debugging Android devices is just as slick as Safari. WebSockets provide a snappy connection.
weinre
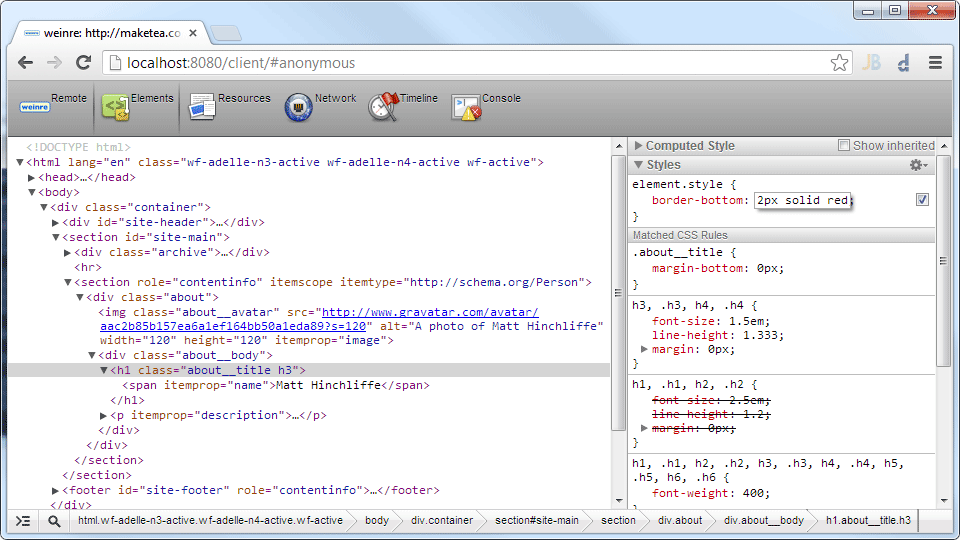
Weinre (In browser, free and Open Source) can be used to debug almost any browser, anywhere. It’s now part of the Apache Cordova project, available as a package via NPM and provides a visual clone of the old WebKit Inspector in the browser running on top of a local server. Pages are connected to the server by dropping in a script, which can also be done via a bookmarklet. It cannot access a lot detailed information but there is enough to tackle or at least gather an understanding of CSS, JavaScript and network issues.
Automated cross-browser testing
Both Sauce Labs and BrowserStack have the tools to run both unit and integration tests across multiple browsers and devices but unlike the simple applications listed above they require an up-front investment to setup. If you’re working as part of a team I have no doubt the initial investment on setting up such an enivornment will be worth it.